Research
Overview
Ph.D.-trained Applied Mathematician and Postdoctoral Fellow at Emory University with expertise in quantitative mathematical modeling, computational biology, artificial intelligence, and data science. My research centers on developing mechanistic and data-driven models of complex systems using ordinary differential equations, dynamical systems, optimization, parameter estimation, and machine learning. I have applied these methods to a wide range of biomedical problems, including neuroscience, immunology, cardiovascular disease, and digital health, with publications in leading journals across computational biology, nonlinear dynamics, and biomedical engineering. Building on this quantitative foundation, I have recently developed a strong interest in applying mathematical modeling, machine learning, and statistical analysis to quantitative finance, portfolio analytics, and investment research.
Research Areas
01 Mathematical Modeling & Computational Biology Building mechanistic and data-driven dynamical-systems models of excitable, oscillatory, and regulatory biology — spanning neuron excitability, circadian-immune coupling, metabolic adaptation, and bifurcation-driven entrainment — using tools from nonlinear dynamics, bifurcation theory, and deep learning.
Inferring Neuron Excitability Parameters with Conditional GANs
A central theme of my work is building conductance-based biophysical models of excitable cells and inferring their parameters from data. In Inferring Parameters of Populations of Pyramidal Neuron Models in Alzheimer's Disease Mouse Models Using Generative Adversarial Networks, we used a Hodgkin-Huxley-style model of pyramidal neuron excitability and a GAN-based inference scheme to recover ion-channel conductances that reproduce experimentally observed firing patterns — including the altered excitability seen in Alzheimer's disease mouse models.
The widget below walks through that six-step pipeline — from the mechanistic model, through parameter fitting and sensitivity-based dimensionality reduction, to building a synthetic training set and training the conditional GAN that ultimately infers parameters from real experimental recordings.
Dynamic Entrainment in the Hodgkin-Huxley Model
In Dynamic Entrainment: A Deep Learning and Data-Driven Process Approach for Synchronization in the Hodgkin-Huxley Model, we studied how a neuron's spiking response to a repeated current pulse depends continuously on a data-driven model parameter. The figure below shows that dependence directly: as the parameter is varied, a small subthreshold "echo" following the first spike gradually grows until it crosses threshold and becomes a full second spike — the system moving continuously from a single-spike response to a fully entrained two-spike response to the same repeated stimulus.
Figure: simulated voltage response V(t) (black) to a repeated current pulse (red) as the fitted parameter varies — the second pulse's response grows from a subthreshold bump into a full spike.
Modeling Circadian Clock Regulation of Immune System Response to SARS-CoV-2 Infection
In Modeling Circadian Clock Regulation of Immune System Response to SARS-CoV-2 Infection and Antiviral Treatment (Wei, Saghafi, Khan & Diekman, Journal of Biological Rhythms, 2025), we coupled a circadian pacemaker model to a mechanistic model of SARS-CoV-2 infection dynamics and immune response fit to viral load data from COVID-19 patients.
Driving each of the immune model's 11 parameters with the circadian clock signal, we found that circadian variation in some parameters (e.g. the innate immune response rate and viral death rate) speeds up viral clearance, while variation in others (e.g. the infection rate and viral production rate) slows it down. Simulating treatment with the antiviral drug remdesivir, we further found that a dose given in the morning (ZT0) clears the virus substantially faster than the same dose given in the evening (ZT12) — a proof-of-concept for chronotherapy in COVID-19 treatment.
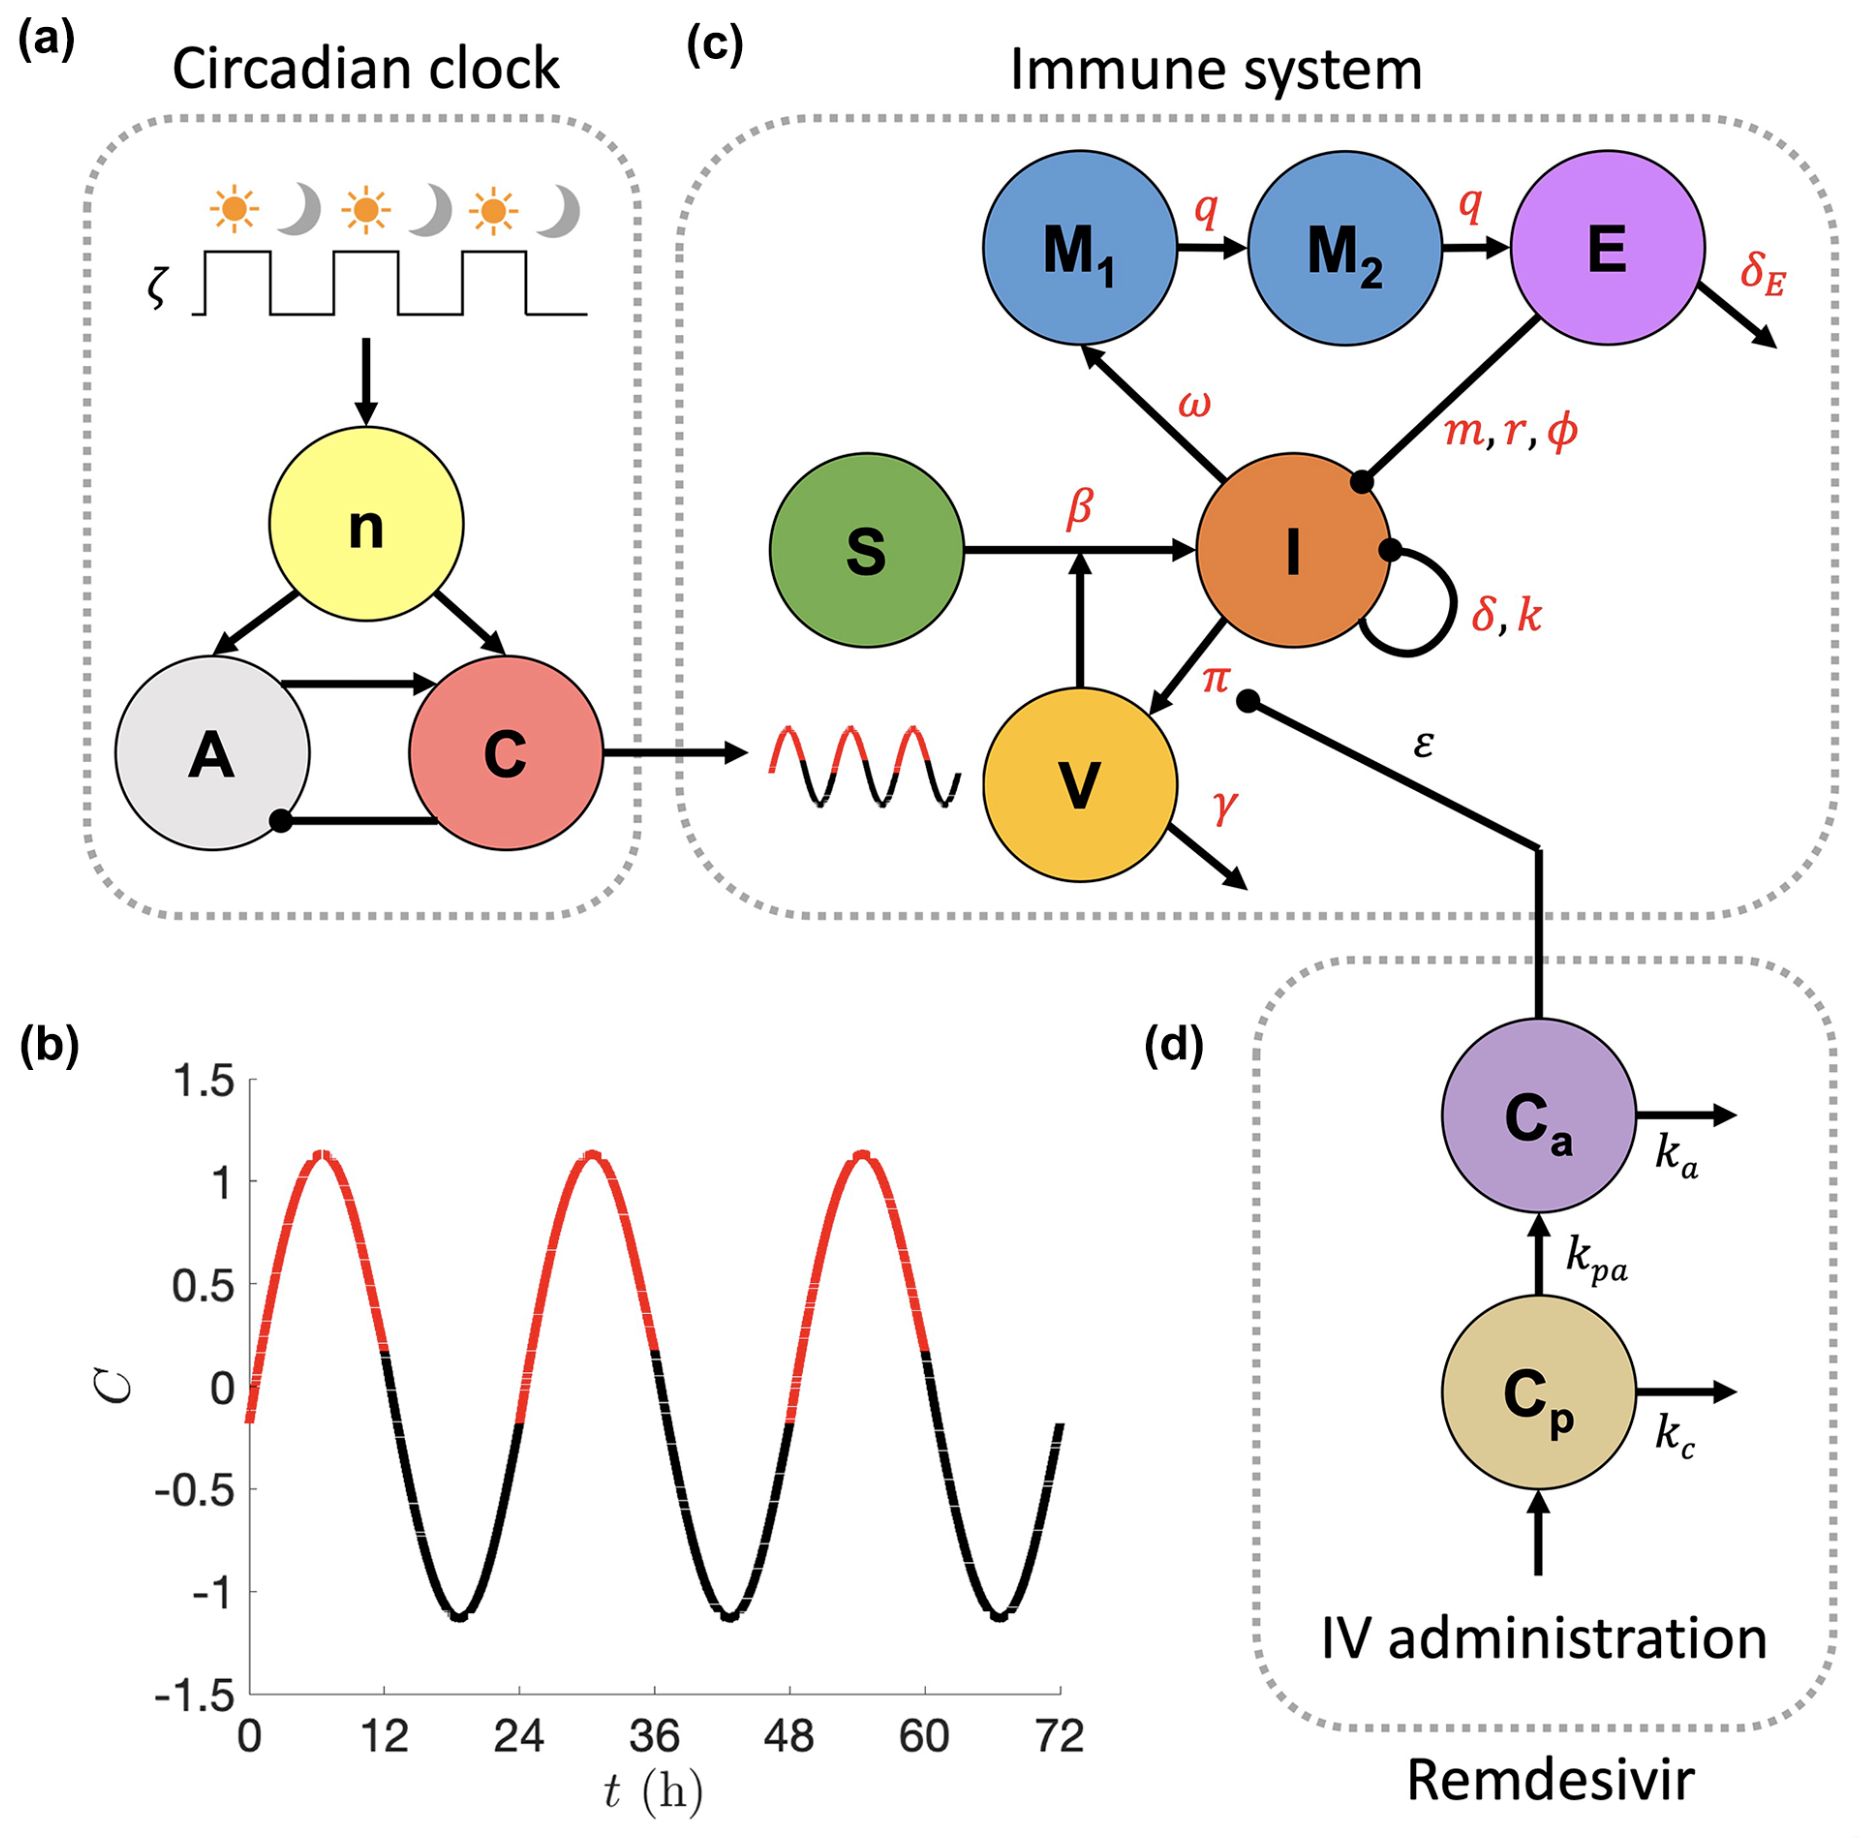
The model couples three components: a circadian pacemaker (n, A, C) driven by the light–dark cycle; an immune-response model tracking susceptible cells (S), virus (V), infected cells (I), and the precursor/effector immune cells (M₁, M₂, E); and a two-compartment pharmacokinetic model of remdesivir (Cᴰ, Cᴸ). The circadian signal C modulates 11 parameters of the immune model (shown in red), while active drug reduces the viral production rate by a factor of 1−ε.
Modeling Metabolic State Transitions in Obesity Using a Time-Varying Lambda–Omega Framework
In Modeling Metabolic State Transitions in Obesity Using a Time-Varying Lambda–Omega Framework (Saghafi & Clifford, 2026), we introduce a dynamical-systems account of metabolic adaptation — the body's tendency to fight back against weight loss far more strongly than it resists weight gain. Rather than treating body-weight regulation as a static energy-balance equation, we model it with a classical λ–ω oscillator whose stability parameters are allowed to drift slowly over time, letting the model represent a gradual reshaping of the body's regulatory landscape rather than a fixed attractor.
As the nullclines of the system deform smoothly, the model reproduces three physiologically meaningful regimes: a slow transition from an unstable to a stable fixed point that produces a plateau in oscillation amplitude — the model's analogue of the stubborn metabolic adaptation plateau seen in real weight-loss data; a slowly growing limit cycle that captures the gradual, easy-to-miss creep of chronic overfeeding; and a slowly shrinking limit cycle that captures durable, well-paced weight loss. The three animations below show these three cases side by side.
Case 1 · Metabolic adaptation
A smooth nullcline shift slowly converts an unstable fixed point into a stable one. Oscillation amplitude stays nearly constant during the transition, then collapses — the model's plateau.
Case 2 · Overfeeding
The fixed point stays unstable while the limit cycle itself grows, representing the slow, largely unnoticed drift of sustained caloric surplus into a larger-amplitude metabolic state.
Case 3 · Weight loss
Λ(r,t) becomes progressively more negative, and the limit cycle contracts cycle by cycle — a gradual, sustainable collapse toward a smaller metabolic steady state.
Three regimes of the time-varying λ–ω model, driven purely by a slow deformation of the system's nullclines — no discrete switch is imposed.
The Emergence of Polyglot Entrainment Responses to Periodic Inputs Near Hopf Bifurcations in Slow-Fast Systems
A periodically forced oscillator typically entrains to the input over a single, connected range of forcing frequencies — the familiar "Arnold tongue" picture. In this project we show that the FitzHugh–Nagumo (FHN) model can instead entrain 1:1 with the input over several separate, disconnected frequency bands when the unforced system sits near a Hopf bifurcation and the forcing amplitude is low. We call this a polyglot entrainment structure, to distinguish it from the ordinary single-band (monoglot) case.
Phase-plane analysis explains why: polyglot entrainment emerges specifically when the Hopf point sits near a knee of the system's cubic-like nullcline, a slow-fast geometric feature. The same phenomenon reappears in other slow-fast oscillator models drawn from neuroscience, circadian biology, and glycolysis, suggesting it is a general feature of forced oscillators near this kind of bifurcation — not a quirk specific to the FHN model. The videos below show the forced FHN system's response for two different waveforms of periodic input, sinusoidal and square.
Sinusoidal forcing
Response of the FHN model near a Hopf bifurcation to sinusoidal periodic forcing, showing multiple disconnected 1:1 entrainment segments as the forcing frequency is varied.
Square-wave forcing
The same near-Hopf FHN system under square-wave forcing, showing that the polyglot entrainment structure persists across different input waveforms.
Polyglot (multi-band) 1:1 entrainment in the forced FHN model under two forcing waveforms.
02 Healthcare Analytics & Machine Learning Developing robust machine learning systems that transform complex, real-world clinical data into scalable healthcare solutions. My work spans wearable sleep and activity monitoring, 12-lead ECG analysis, digitization of scanned and photographed medical records, and ambient sensing through sparse indoor sensor networks. Across these projects, I focus on building open, reproducible, and clinically relevant AI systems that perform reliably on noisy, real-world data at scale.
Predicting Traumatic Brain Injury Using Temporal Attention on Sleep-Wake Data
In Predicting Traumatic Brain Injury Post-Trauma Using Temporal Attention on Sleep-Wake Data (Saghafi, Li, Neylan, Thomas, Stevens, Jovanovic, Germine, Bucher, Huibregtse, Linnstaedt, An, Harnett, Norrholm, Conti, Seligowski, Dillon, Vizer, McKibben, Albertorio-Sáez, Beaudoin, Matson, Calhoun, Harte, Bruce, Haran, Storrow, Lewandowski, Musey, Hendry, Swor, Pearson, Peak, O'Neil, Kessler, Koenen, McLean, Clifford & Bahrami Rad, IEEE JBHI preprint), we ask a practical question for wearable-based TBI screening: after someone comes through the emergency department with a possible brain injury, how many days of wrist-worn sleep/wake data actually need to be collected to tell TBI-positive and TBI-negative patients apart?
Using the AURORA study cohort — more than 2,000 emergency department patients wearing a research wristwatch for weeks after trauma, with TBI status defined by a GFAP blood-biomarker cutoff — we extracted both daily sleep features (total sleep time, fragmentation, wake episodes, ENMO, etc.) and fine-grained, minute-level activity time series. A deep network combining residual convolutional blocks with a temporal self-attention layer was trained to classify TBI+ vs. TBI- directly from the activity time series, letting the model learn for itself which days after the injury actually matter for the decision, rather than assuming every day contributes equally.
The attention weights told a clear story: the model consistently focused most heavily on the first 7 days post-injury, with attention tapering off over the following two weeks. Classification performance backed this up directly — restricting the model to the first 7 days of data outperformed using 14 or 21 days (81% sensitivity vs. 40% and 45%, respectively, with the highest F1 score at 7 days), and the attention-based network beat both logistic regression and SVM baselines at every window length. In short, more data isn't always better: for TBI screening from sleep/wake patterns, the first week after trauma carries the signal, and later days mostly add noise.
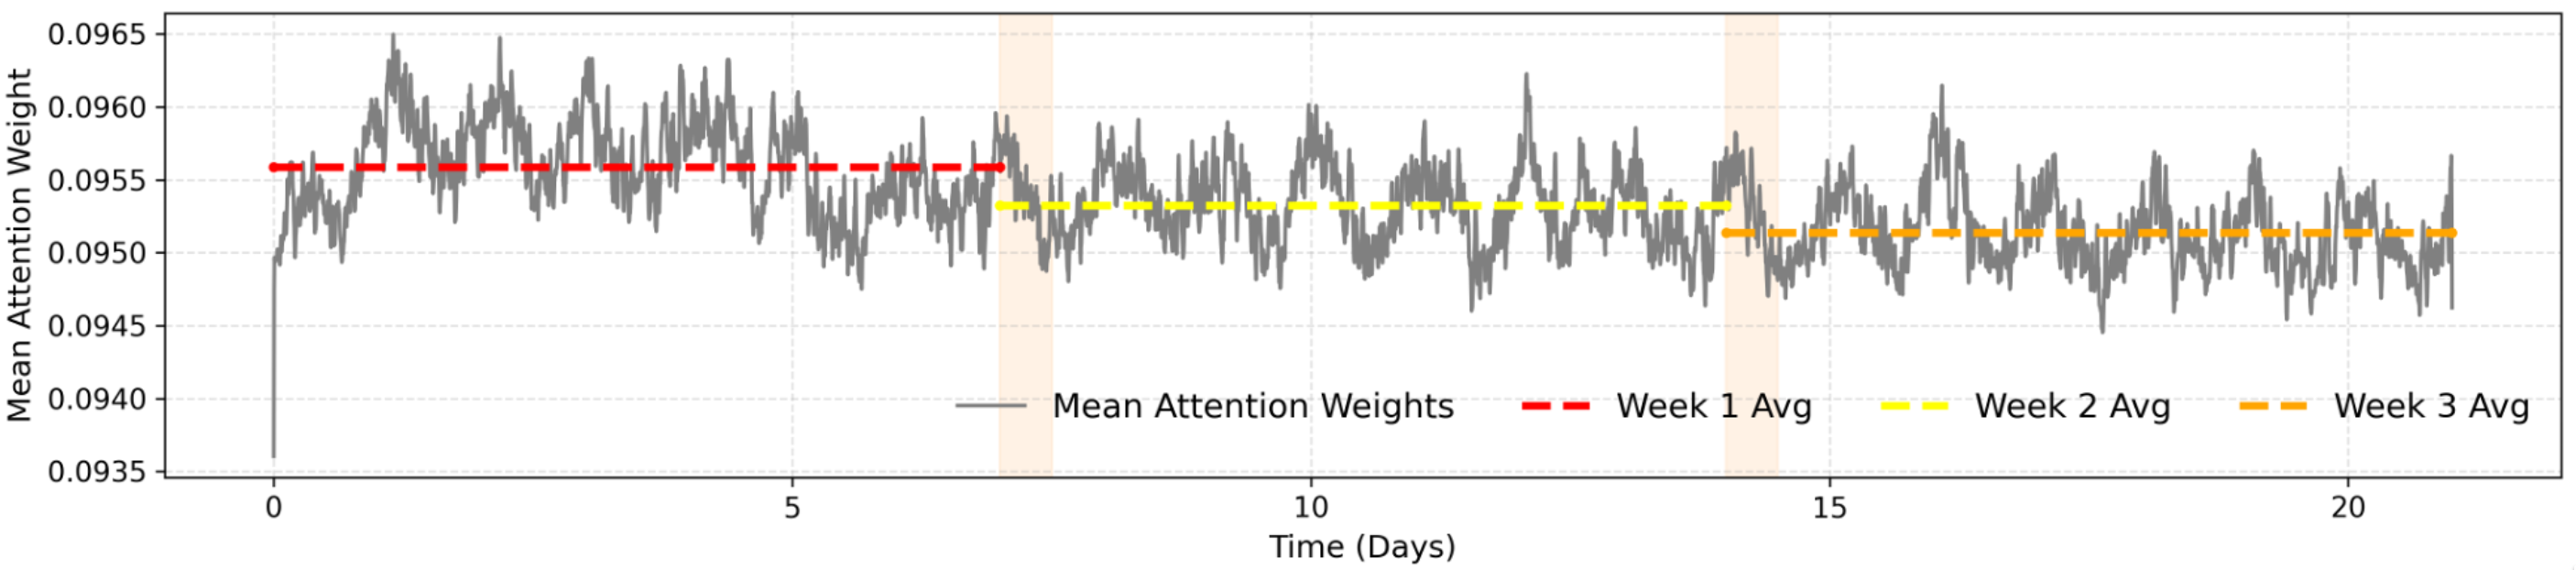
Averaged across patients and cross-validation folds, the model's attention weight is highest in week 1 post-injury (red) and steadily declines through weeks 2 (yellow) and 3 (orange) — the model itself has learned that early data matters most for telling TBI+ from TBI- patients.
Detection of Chagas Disease from the ECG: The George B. Moody PhysioNet Challenge 2025
In Detection of Chagas Disease from the ECG: The George B. Moody PhysioNet Challenge 2025 (Reyna, Saghafi, Koscova, Weigle, Pavlus, Elola, Seyedi, Campbell, Li, Barreto, Sabino, Ribeiro, Ribeiro, Sameni & Clifford, Physiological Measurement, 2026), we ran the 26th George B. Moody PhysioNet Challenge, inviting teams worldwide to build algorithms that flag likely Chagas disease — a parasitic infection endemic to Latin America that can silently damage the heart for years before causing arrhythmias or heart failure — directly from a standard 12-lead ECG, since confirmatory blood (serological) testing capacity is scarce in the regions that need it most.
The Challenge assembled over 378,000 ECGs across six databases (a large weakly-labeled Brazilian cohort for training, plus three completely hidden datasets — REDS-II, SaMi-Trop 3, and ELSA-Brasil — for validation and test) and scored entries with a custom metric, TPR@5%: the true positive rate achieved among only the top 5% of patients an algorithm ranks as highest-risk, mirroring the roughly 5% serological testing capacity available in real Chagas-endemic settings. We also built ensemble models (arithmetic mean, geometric mean, and median) combining the top-performing individual entries, and benchmarked everything against a previously published baseline model and against ECGFounder, a general-purpose ECG foundation model.
Over 650 participants across 111 teams submitted more than 1,300 entries. The best individual model (Biomed-Cardio) reached a mean TPR@5% of 0.323, but our simple ensembles proved more robust across datasets — the arithmetic-mean ensemble averaged 0.295 and generalized better to the hardest, most-realistic dataset (ELSA-Brasil, a largely asymptomatic screening-style population), clearly outperforming both the baseline model (0.107) and the ECGFounder foundation model (0.242). In practical terms, the top approaches could identify roughly one in two Chagas patients in a symptomatic cohort, and about one in six in a largely asymptomatic screening population — versus the one-in-fifty rate expected from testing at random. Feature-importance analysis further showed the models were keying in on clinically sensible signals: conduction-system abnormalities, bradyarrhythmias, fascicular/bundle branch blocks, and ventricular depolarization patterns consistent with chronic Chagas cardiomyopathy, reproducible across all three hidden datasets.
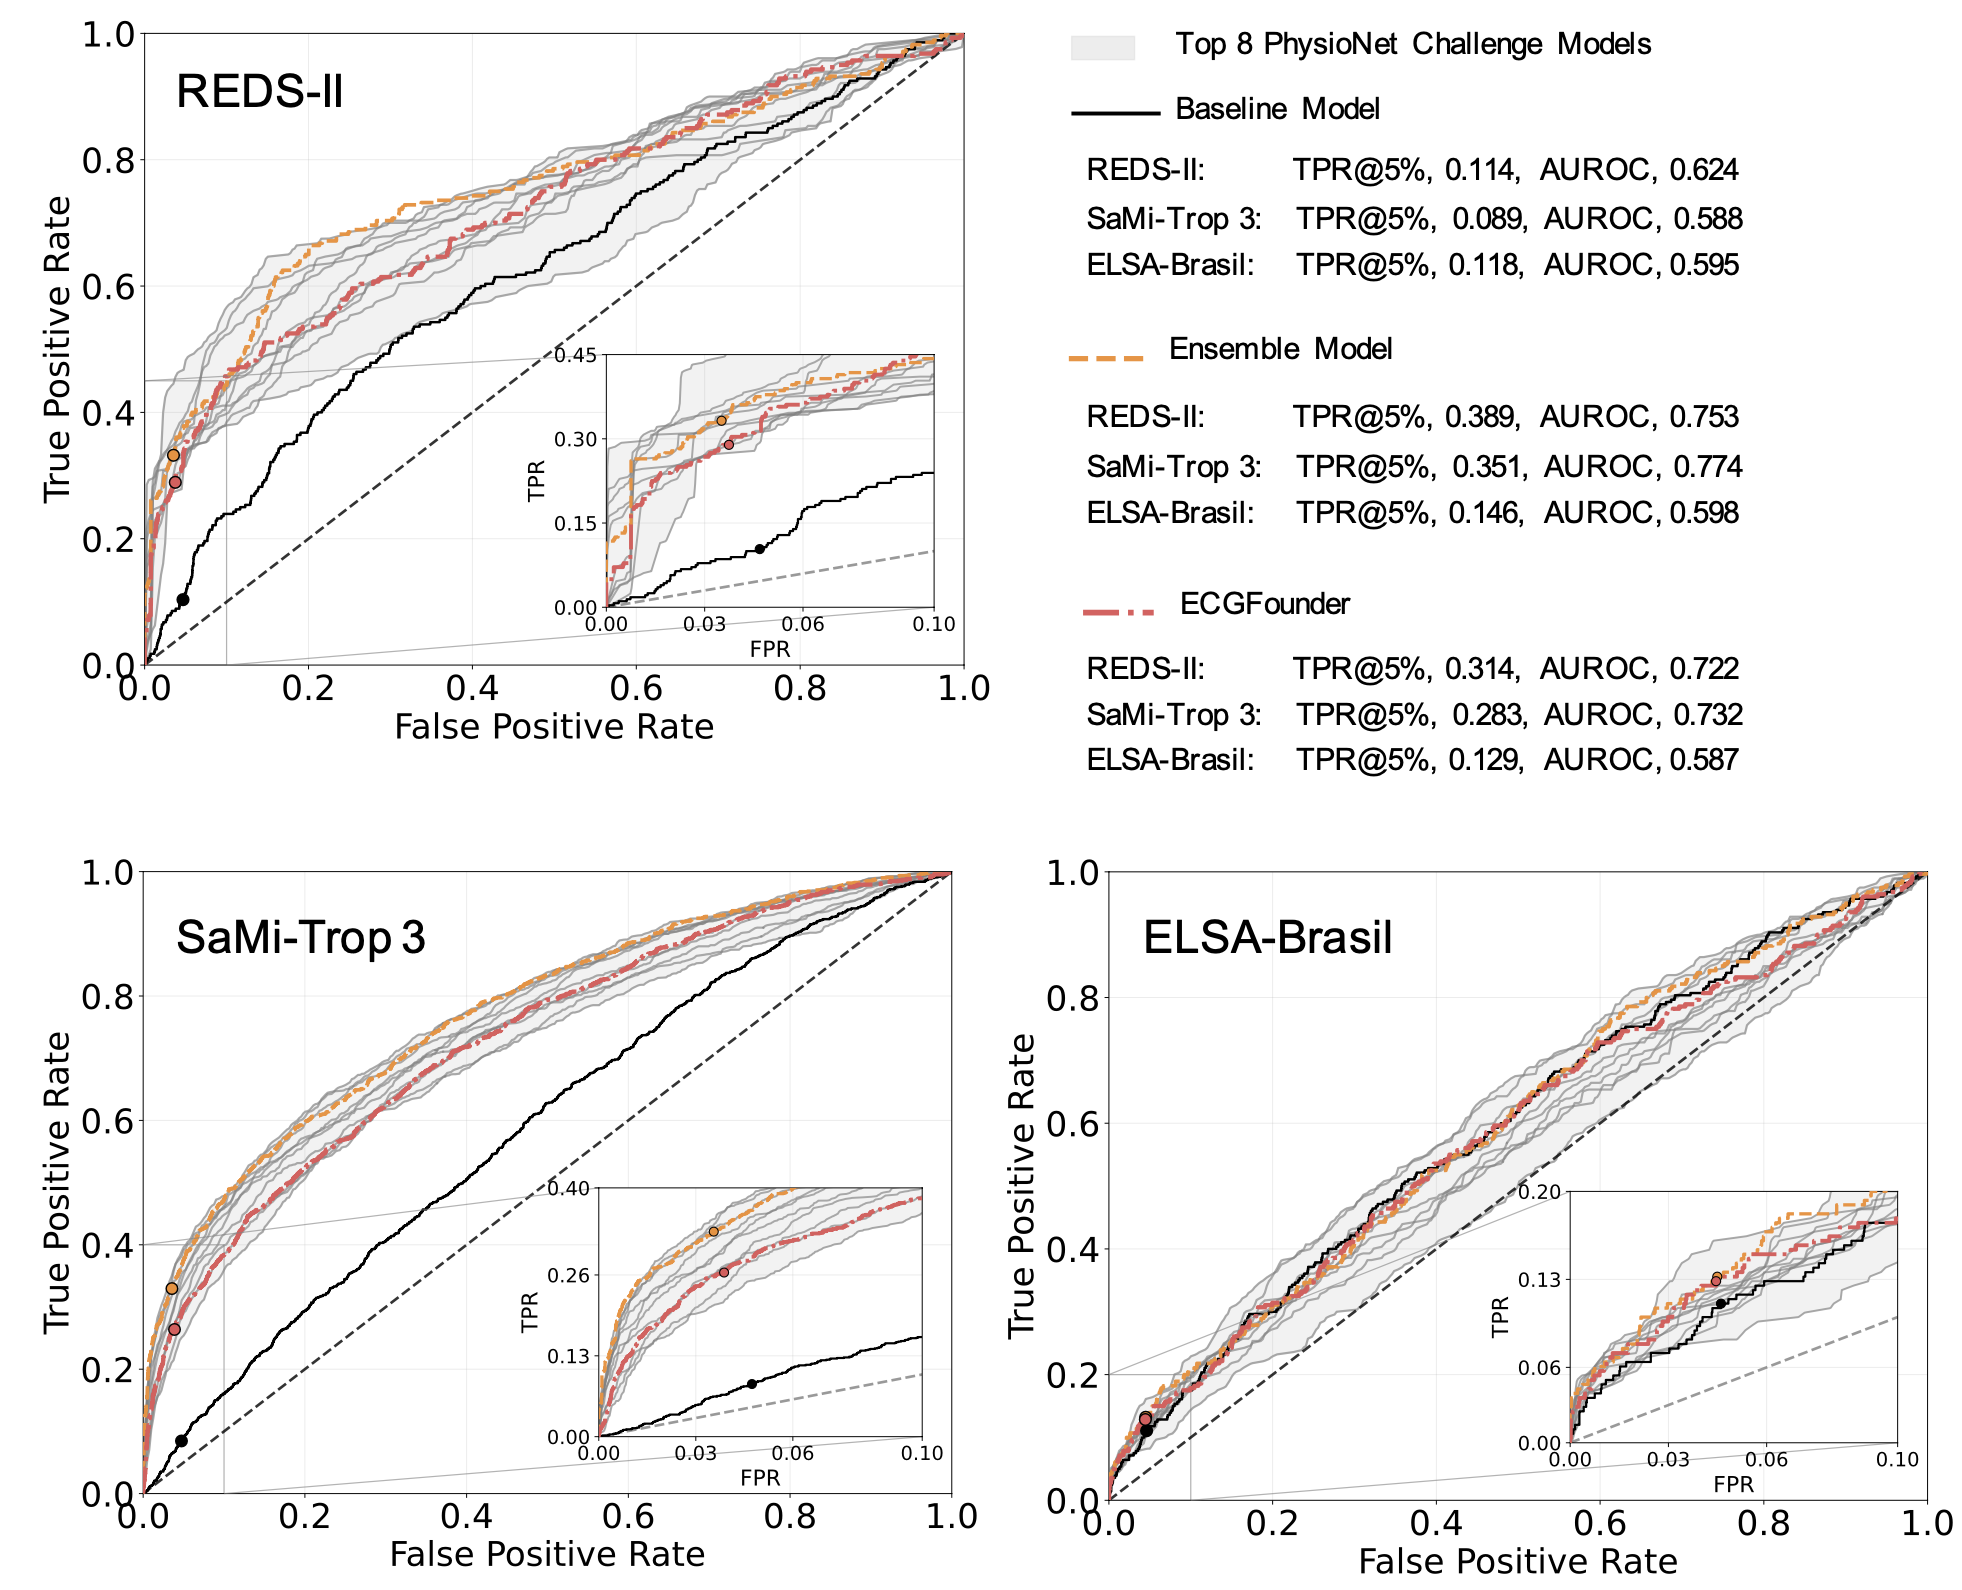
ROC curves across the three hidden test datasets: the ensemble model (orange) consistently sits above both the ECGFounder foundation model (red) and the baseline (black), with the gray band showing the spread of the top 8 individual Challenge entries. The insets zoom into the low false-positive-rate region that matters most for real-world screening, where the ensemble's advantage is clearest on REDS-II and SaMi-Trop 3, and more modest on the harder ELSA-Brasil cohort.
ECG-Image-Database: Paired ECG Images and Time-Series with Real-World Artifacts
In ECG-Image-Database: Large-Scale Paired ECG Images and Time-Series with Real-World Artifacts; A Foundation for Computerized ECG Digitization and Analysis (Reyna, Deepanshi, Weigle, Koscova, Campbell, Shivashankara, Saghafi, Nikookar, Motie-Shirazi, Kiarashi, Seyedi, Hassannia, Bjørnstad, Stenhede, Ranjbar, Clifford & Sameni, Physiological Measurement, 2026), we tackle a quieter but equally urgent problem in cardiology: countless decades of ECGs exist only as paper printouts or scanned images, with no accompanying digital waveform, and are steadily being lost to decay, fires, floods, or simple archive attrition before anyone can mine them for research or diagnosis.
To give the field something to train and test digitization algorithms on, we built a large, openly released dataset that pairs real digital ECG time series with images of what those same ECGs look like after being printed and then degraded in realistic ways. Starting from 1,977 records drawn from PTB-XL (Germany) and Emory Healthcare (USA), we used our open-source ECG-Image-Kit to generate synthetic printouts, then subjected physical copies to soaking, coffee and sauce stains, creases, mold growth, and re-photography or re-scanning under varied lighting and devices — alongside purely digital distortions like rotations, perspective warps, and handwritten annotations. We also added a fully real-world clinical arm: 266 thermal-paper ECGs collected during routine care at Akershus University Hospital in Norway, each photographed and scanned multiple ways under ordinary clinical handling (creasing, faint annotations, natural wear).
The result is 37,191 images spanning 2,243 unique ECG records across three countries, each image still linked back to its original ground-truth waveform — from clean electronic printouts to severely water-damaged, moldy, or badly-lit phone photos. This resource has already served as the training and test data for the PhysioNet Challenge 2024 on ECG digitization and a follow-up 2025–2026 Kaggle challenge; top-performing algorithms from those challenges reconstructed waveforms at over 22 dB SNR, with clinically important measurements (PR interval, QT interval, QRS duration, heart rate, ST-segment) statistically indistinguishable from the original signals under moderate degradation. In short, this gives the community a shared, realistic benchmark for turning the world's paper ECG archives back into usable digital data before that history disappears for good.
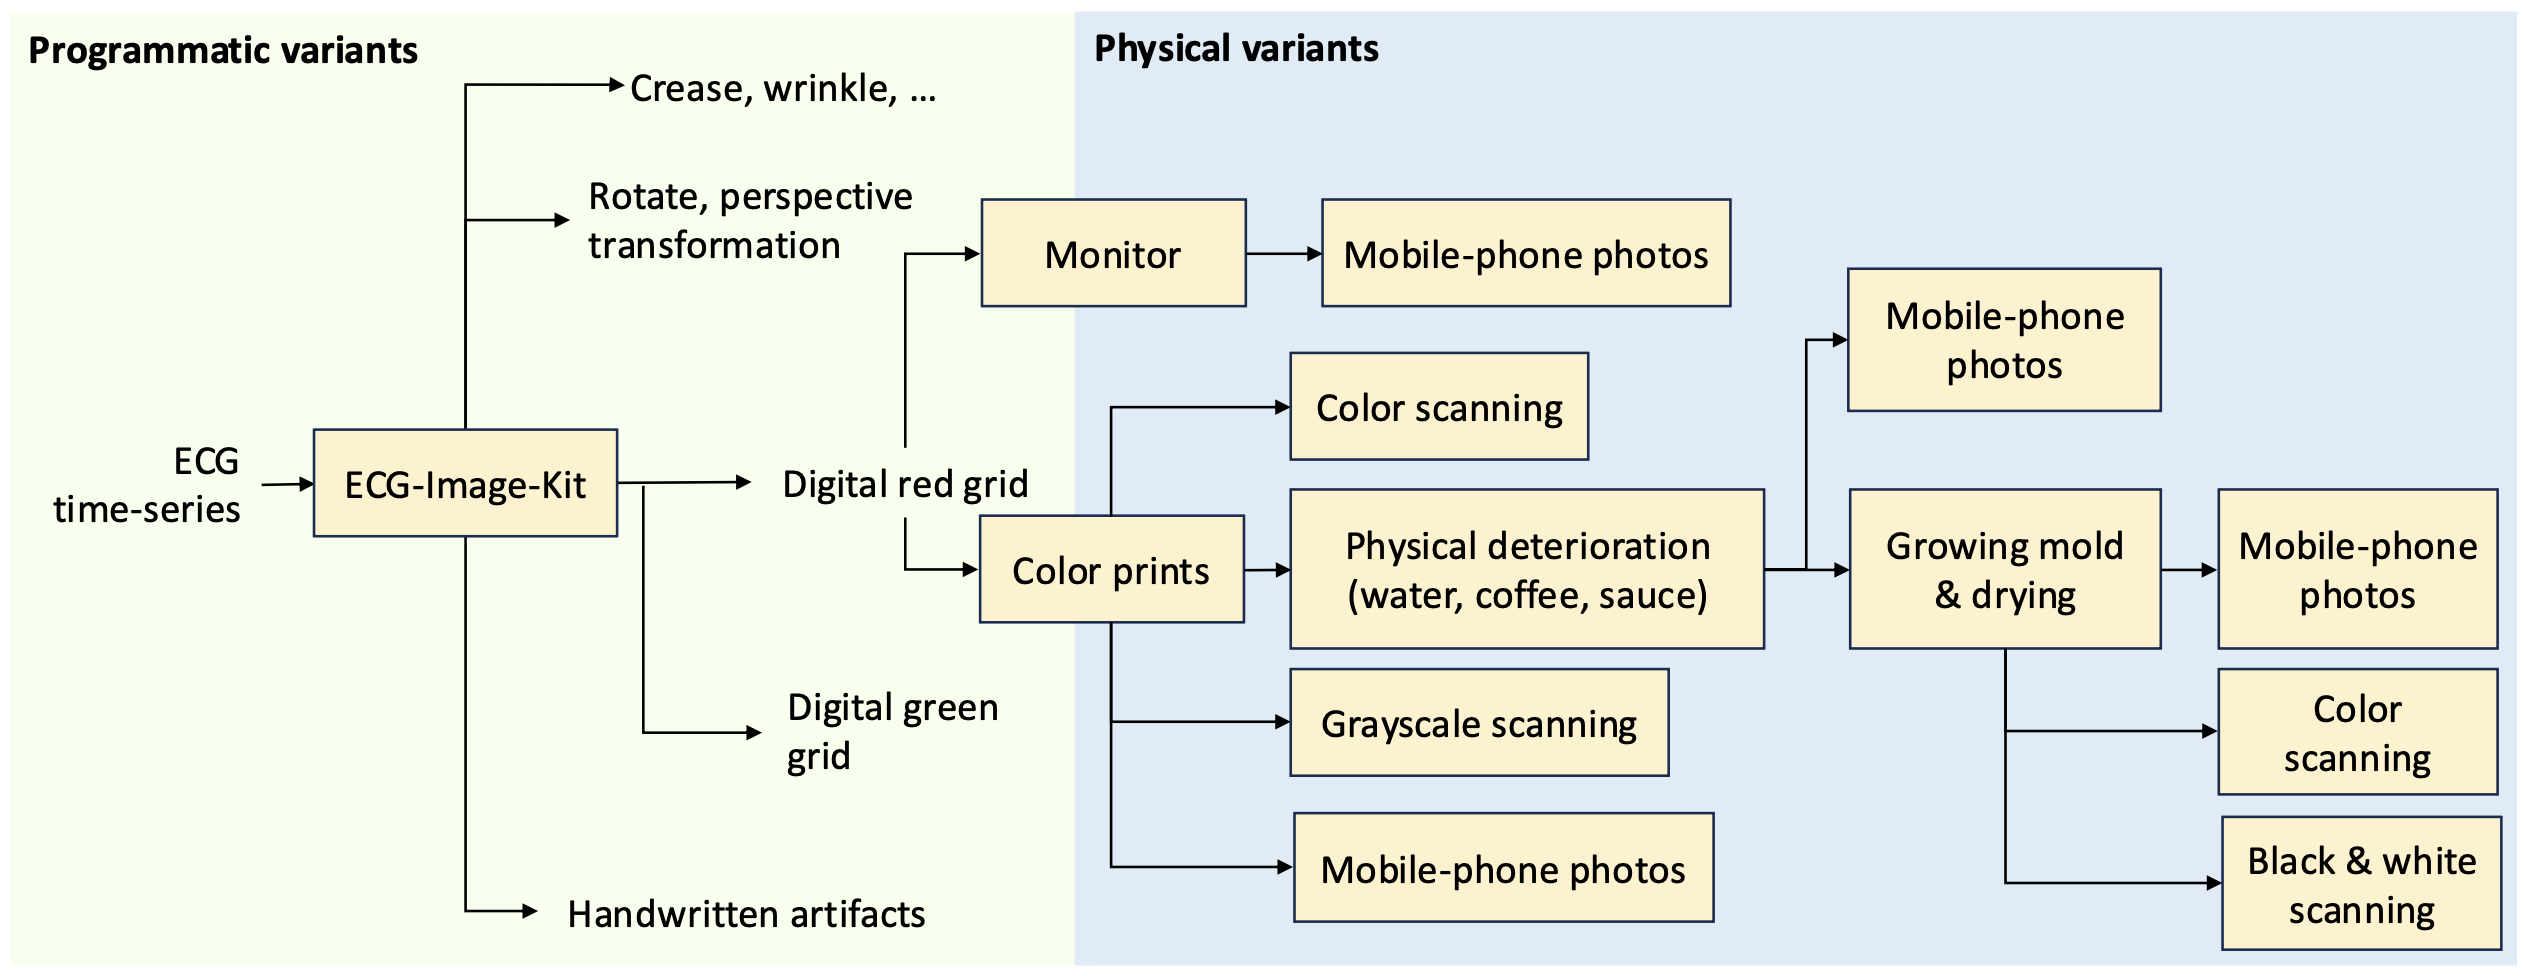
The dataset-creation pipeline: each ECG time series is rendered into a printout-style image (with optional programmatic distortions like creases or handwriting), then physically printed and pushed through real-world degradation paths — scanning, phone photos, staining, and mold — producing many linked image variants of the same underlying signal.
Graph Trilateration for Indoor Localization with Sparse BLE Receivers
In Graph Trilateration for Indoor Localization in Sparsely Distributed Edge Computing Devices in Complex Environments Using Bluetooth Technology (Kiarashi, Saghafi, Das, Hegde, Madala, Nakum, Singh, Tweedy, Doiron, Rodriguez, Levey, Clifford & Kwon, Sensors, 2023), we tackle a problem that standard Bluetooth low energy (BLE) trilateration is not built for: localizing people in a large, structurally complex space (1700 m²) using edge receivers that are sparse and unevenly spaced, rather than densely and uniformly installed. The study site is a real clinical facility used for therapeutic activities with participants who have mild cognitive impairment (MCI), instrumented with 39 ceiling-mounted Raspberry Pi edge computing devices.
Standard trilateration needs at least three receivers detecting a stable RSSI at once — a condition that rarely holds when receivers are sparse and signals are degraded by metal ceiling structures. Our graph trilateration method instead treats every edge device that detects a beacon as a node in a graph, and uses the received hits strength index (RHSI) — how many times a device detects the beacon within a sliding time window — alongside RSSI to weight each pairwise distance estimate. Two variants were compared: RHSI-Agg, which aggregates pairwise location estimates using RHSI-based weights, and RHSI-Edge, which folds RHSI into each pairwise distance estimate before averaging. Corner cases with fewer than three detecting devices, and temporal smoothing across consecutive time windows, were also handled explicitly.
Across the full study site, graph trilateration cut the average positioning error from 6.39 m (standard trilateration) to as low as 4.44 m, and improved region-level localization accuracy from 65.7% to 85.2%. Performance varied by region depending on receiver density — the best-covered corridor achieved over 90% room-level accuracy, while sparser regions lagged, confirming that receiver density and positioning accuracy are directly linked. The work also established the open-source edge computing framework (Raspberry Pi 4-based receivers, ~$200/unit) that our subsequent multi-beacon study builds on.
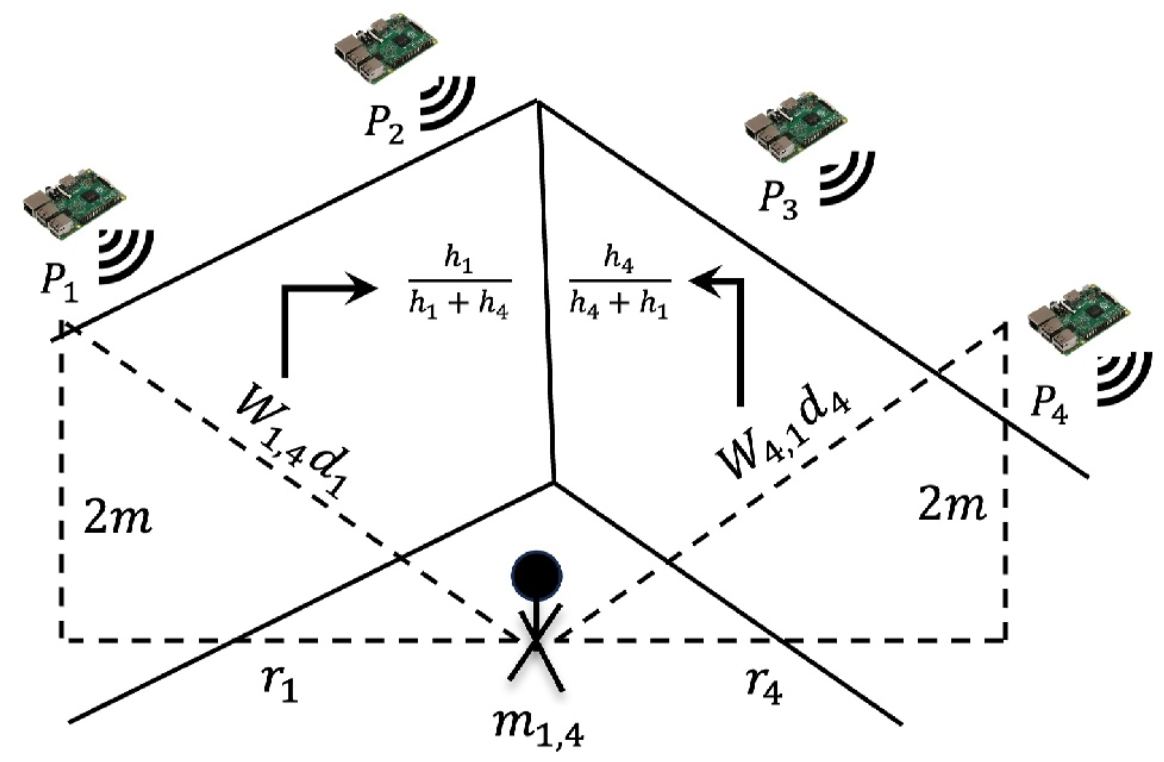
RHSI-edge trilateration: for a pair of edge devices (e.g. P₁ and P₄), the received hits strength index (h₁, h₄) weights each device's lateral distance to the subject, and the weighted estimates are averaged to localize the subject's position.
Optimizing Multi-Beacon Deployment for Indoor BLE Localization
In Indoor Localization Using Multi-Bluetooth Beacon Deployment in a Sparse Edge Computing Environment (Saghafi, Kiarashi, Rodriguez, Levey, Kwon & Clifford, Digital Twins and Applications, 2025), we extend our earlier graph trilateration approach for BLE-based indoor localization by asking a practical deployment question: rather than adding more fixed ceiling-mounted receivers, what happens if a person simply wears more BLE beacons at once?
Working in the same 1700 m² clinical facility — instrumented with 39 sparsely distributed Raspberry Pi edge receivers — participants wore a belt carrying up to seven BLE beacons simultaneously. Each beacon's individual localization accuracy (via RHSI-edge trilateration) was ranked from worst to best, and beacons were then combined incrementally, worst-performing first, to see whether pooling noisy, independent transmitters could compensate for any single beacon's poor signal reception. We also modeled the effect statistically: if each beacon has an independent probability p of a successful RSSI reception in a given window, the probability that at least one of N worn beacons is received is 1 − (1−p)N, which → 1 as N grows — the statistical basis for why redundant beacons help.
The result was a clear diminishing-returns curve: localization error fell sharply from a worst-case 9.09 m with a single beacon to 2.94 m with three beacons combined, after which adding a fourth, fifth, sixth, or seventh beacon produced only marginal further improvement. The benefit of extra beacons was also more pronounced in low-density regions of the facility (fewer nearby receivers) than in high-density regions, where a single beacon was already reasonably well served. Practically, this points to three simultaneously worn beacons as a sensible operating point for sparse edge-computing deployments — enough redundancy to guard against dropped signals, without the cost or interference risk of instrumenting every participant with many transmitters.
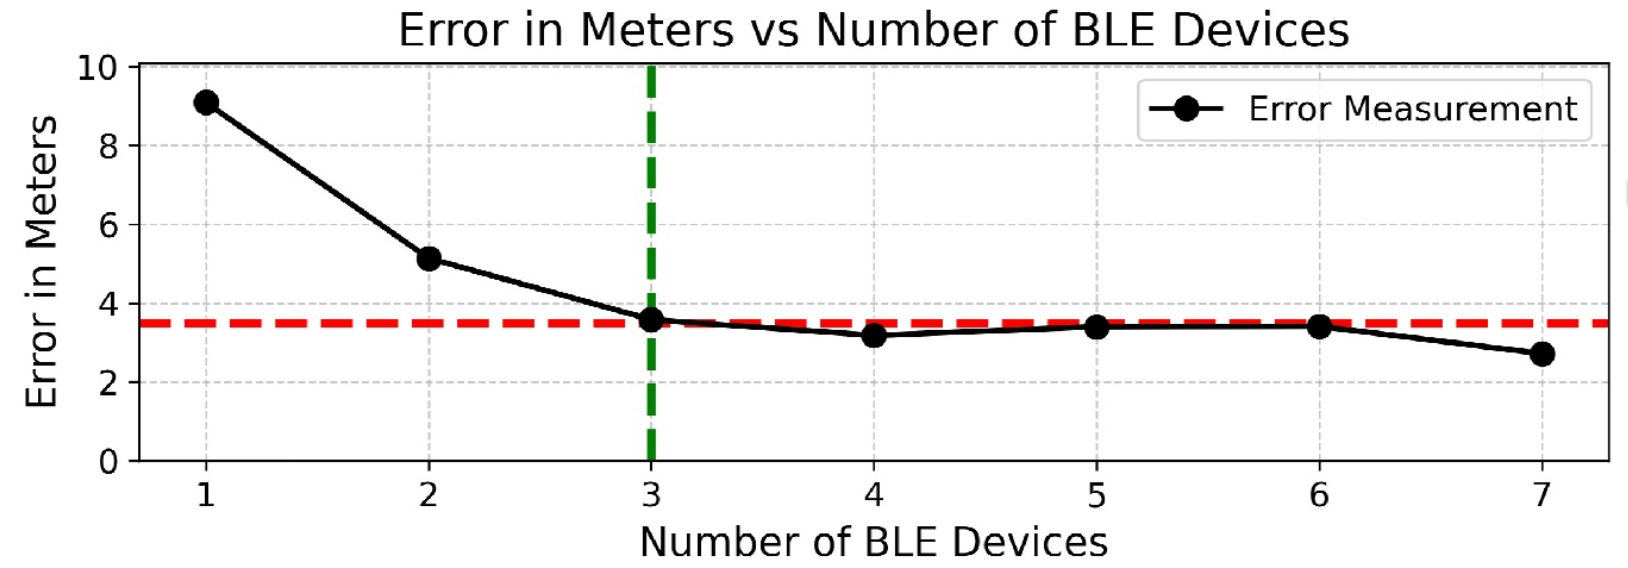
Localization error falls sharply as beacons are added, crossing the ~3.5 m plateau line right around 3 devices — beyond that, adding a 4th through 7th beacon buys only marginal further improvement.
03 Quantitative Finance & Financial Analytics Extending quantitative and data-driven modeling techniques from biomedical systems to financial time series and decision-making.
[Project Title]
Demo coming soon — let me know which paper or project you'd like featured here.